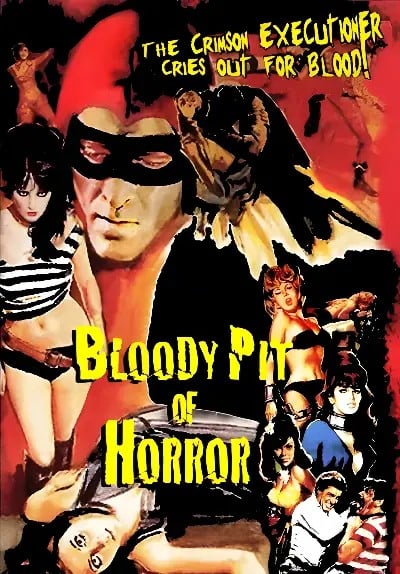
Every champion team has certain identifiable characteristics as well as plenty of intangible ones.
But is it possible to predict, based on the evidence of the first 25 seasons of the NRL era, who can and cannot win the premiership this time around?
An in-depth analysis of 13 key performance indicators for the 13-a-side game reveals there are only four teams who stand a chance of holding the Provan-Summons Trophy aloft on October 1 at Accor Stadium.
That is, if you believe in the weight of history when it comes to how the previous 25 teams have stacked up when it comes to lead-up form, attack and defence stats, for and against, home and away records, their number of Origin reps, how experienced their coach was and goal-kicking percentages.
After tallying up all the records over the past quarter-century and then eliminating the current teams – Survivor style – that don’t meet those benchmarks, there are 13 that are either no hope or in need of a drastic turnaround in the remaining months of the season to become premiers.

(Photo by Mark Kolbe/Getty Images)
Here are the key stats and how important they are in building a premiership-winning team
Key performance indicators for premiers
Lead-up form
Of the 25 premiership-winning teams since 1998, all but three of them made the finals the previous season.
The only outliers were the 2003 Panthers, who were 12th the year before, the 2005 Tigers (up from their customary ninth in ‘04) and the 2013 Roosters, who were all the way down in 13th spot 12 months earlier.
Seventeen premiers (68%) finished in the top four the year before.
The halfway mark of a premiership season is a more reliable indicator with only Tim Sheens’ Tigers surging all the way from outside the top eight – they were 11th in ‘05 before completing their improbable run.
And when it comes to the regular season, it’s clear – you have to finish in the top four if you want to get your hands on the trophy. No one has done so from a lower rank since the 1995 Bulldogs.
Year | Premiers | Previous season | Halfway mark of season | Regular season finish |
1998 | Broncos | Premiers | 5th | 1st |
1999 | Storm | 3rd | 3rd | 3rd |
2000 | Broncos | 8th | 1st | 1st |
2001 | Knights | 3rd | 1st | 3rd |
2002 | Roosters | 6th | 6th | 4th |
2003 | Panthers | 12th | 3rd | 1st |
2004 | Bulldogs | 3rd | 2nd | 2nd |
2005 | Tigers | 9th | 11th | 4th |
2006 | Broncos | 3rd | 1st | 3rd |
2007 | Storm* | Minor premiers | 1st | 1st |
2008 | Sea Eagles | 2nd | 1st | 2nd |
2009 | Storm* | Minor premiers | 6th | 4th |
2010 | Dragons | Minor premiers | 1st | 1st |
2011 | Sea Eagles | 8th | 3rd | 2nd |
2012 | Storm | Minor premiers | 1st | 2nd |
2013 | Roosters | 13th | 3rd | 1st |
2014 | Rabbitohs | 2nd | 5th | 3rd |
2015 | Cowboys | 5th | 2nd | 3rd |
2016 | Sharks | 6th | 1st | 3rd |
2017 | Storm | 2nd | 1st | 1st |
2018 | Roosters | 2nd | 7th | 1st |
2019 | Roosters | Premiers | 3rd | 2nd |
2020 | Storm | 2nd | 3rd | 2nd |
2021 | Panthers | 2nd | 1st | 2nd |
2022 | Panthers | Premiers | 1st | 1st |
Attack and defence
The old adage that premierships are built on defence is not necessarily true.
And you don’t always have to score the most points to emerge as premiers, but it definitely helps.
Only three of the 25 champion outfits didn’t finish in the top four for points scored – the 2002 Roosters (sixth), ‘06 Broncos (12th) and ‘10 Dragons (eighth).
And you need to rack up 40 at least once in the season – only the St George Illawarra side of 13 years ago, which topped out at 38, didn’t make it out of the 30s.

Jamie Soward, Wayne Bennett and Dean Young celebrate after the 2010 Grand Final win by St George Illawarra. (Photo by Mark Nolan/Getty Images)
When it comes to defence, it definitely helps to be stingy but it’s not as important as it’s made out to be.
One in every five premiership-winning side has been ranked fifth or lower for points conceded – the 1999 Storm history-makers (fifth), Newcastle two years later (ninth), the ‘03 Panthers (seventh), the ‘05 Tigers (10th) and the Cowboys of 2015, who were fifth.
And it is true that if you concede 50 in the regular season, you won’t become premiers although Newcastle in 2001 and the Roosters the following year were each a missed conversion away from having a half-century put on them.
Year | Premiers | Rank in attack | Rank in defence | Highest score | Most points conceded |
1998 | Broncos | 1st | 1st | 60 | 28 |
1999 | Storm | 1st | 5th | 62 | 34 |
2000 | Broncos | 1st | 1st | 56 | 28 |
2001 | Knights | 2nd | 9th | 60 | 49 |
2002 | Roosters | 6th | 1st | 58 | 48 |
2003 | Panthers | 3rd | 7th | 52 | 42 |
2004 | Bulldogs | 1st | 3rd | 54 | 40 |
2005 | Tigers | 2nd | 10th | 54 | 44 |
2006 | Broncos | 12th | 1st | 50 | 36 |
2007 | Storm* | 1st | 1st | 58 | 30 |
2008 | Sea Eagles | 1st | 2nd | 52 | 40 |
2009 | Storm* | 11th | 2nd | 48 | 26 |
2010 | Dragons | 8th | 1st | 38 | 32 |
2011 | Sea Eagles | 1st | 2nd | 42 | 32 |
2012 | Storm | 2nd | 1st | 46 | 40 |
2013 | Roosters | 1st | 1st | 56 | 32 |
2014 | Rabbitohs | 3rd | 1st | 50 | 30 |
2015 | Cowboys | 2nd | 5th | 50 | 44 |
2016 | Sharks | 3rd | 2nd | 62 | 32 |
2017 | Storm | 1st | 1st | 64 | 38 |
2018 | Roosters | 4th | 1st | 56 | 30 |
2019 | Roosters | 2nd | 2nd | 58 | 38 |
2020 | Storm | 3rd | 2nd | 50 | 30 |
2021 | Panthers | 4th | 1st | 56 | 37 |
2022 | Panthers | 1st | 1st | 46 | 38 |
For and against
The benchmark for premiers is to be at least 100 points up at the end of the regular season when it comes to for and against.
As is often the case with these metrics, the ragtag 2005 Tigers look like the least probable premiers after only finishing 101 points plus.
But the star-studded Broncos the following year were only four points better before Wayne Bennett secured his final trophy for Brisbane.
Year | Premiers | F&A differential |
1998 | Broncos | 378 |
1999 | Storm | 392 |
2000 | Broncos | 308 |
2001 | Knights | 143 |
2002 | Roosters | 216 |
2003 | Panthers | 132 |
2004 | Bulldogs | 269 |
2005 | Tigers | 101 |
2006 | Broncos | 105 |
2007 | Storm* | 277 |
2008 | Sea Eagles | 290 |
2009 | Storm* | 157 |
2010 | Dragons | 219 |
2011 | Sea Eagles | 208 |
2012 | Storm | 218 |
2013 | Roosters | 315 |
2014 | Rabbitohs | 224 |
2015 | Cowboys | 133 |
2016 | Sharks | 176 |
2017 | Storm | 297 |
2018 | Roosters | 181 |
2019 | Roosters | 264 |
2020 | Storm | 258 |
2021 | Panthers | 286 |
2022 | Panthers | 306 |

Adam Reynolds celebrates during the 2014 GF. (Photo by Mark Nolan/Getty Images)
Home and away record
To be the premiers, you have to win at least eight of your home matches with only the 2014 Rabbitohs, who went 7-5 as hosts, falling short of that benchmark.
And you can’t be a slouch on the road either – all the premiers have managed to win at least half of their away fixtures, apart from the asterisk-addled 2009 Storm side which won just five of 12 games outside of Victoria.
Although they made up for that by getting up in nine of their 11 matches in Melbourne.
Year | Premiers | Home record | Away record |
1998 | Broncos | 10-2 | 8-3 |
1999 | Storm | 9-3 | 7-5 |
2000 | Broncos | 12-0 | 6-6 |
2001 | Knights | 9-4 | 7-5 |
2002 | Roosters | 8-3 | 7-5 |
2003 | Panthers | 8-4 | 10-2 |
2004 | Bulldogs | 11-1 | 8-4 |
2005 | Tigers | 8-4 | 6-6 |
2006 | Broncos | 8-4 | 6-6 |
2007 | Storm* | 12-0 | 9-3 |
2008 | Sea Eagles | 9-3 | 8-4 |
2009 | Storm* | 9-2 | 5-7 |
2010 | Dragons | 9-3 | 8-4 |
2011 | Sea Eagles | 11-1 | 7-5 |
2012 | Storm | 9-3 | 8-4 |
2013 | Roosters | 8-4 | 10-2 |
2014 | Rabbitohs | 7-5 | 8-4 |
2015 | Cowboys | 8-4 | 9-3 |
2016 | Sharks | 11-1 | 6-5 |
2017 | Storm | 9-3 | 11-1 |
2018 | Roosters | 8-4 | 8-4 |
2019 | Roosters | 9-3 | 8-4 |
2020 | Storm | 9-1 | 7-3 |
2021 | Panthers | 12-0 | 9-3 |
2022 | Panthers | 10-2 | 10-2 |
Origin reps, coach’s experience, goal-kicking?
You would think the more Origin representatives you have, the better your chances are to win the competition. And that pretty much bears out.
It’s not an exact science because a team like the Warriors (if they ever won) wouldn’t necessarily have many NSW or Queensland players.
On average, the premiers have 4.76 Origin reps that season but it varies wildly. Seven teams had three or less with the unheralded Panthers and Tigers a couple of decades ago snubbed altogether.
Whether your team has an inexperienced coach or a grizzled old soul calling the shots – the average in terms of seasons experience per premiership-winning mentor is 9.76.

Storm coach Craig Bellamy. (Photo by Cameron Spencer/Getty Images)
But that number has been inflated by Wayne Bennett and Craig Bellamy’s success while there have been seven occasions where coaches have guided their team to glory within their first five years in the caper.
Goal-kicking is also not as crucial as you might think.
In the past decade, no premiership-winning side has kicked at less than 73% but only five of the previous champions were above that mark, which is probably a reflection of the greater accuracy across the board in recent years.
Year | Premiers | Origin reps | Coach experience | Goal-kicking % |
1998 | Broncos | 11 | 12th season | 67.9 |
1999 | Storm | 4 | 10th season | 62.9 |
2000 | Broncos | 7 | 14th season | 72.7 |
2001 | Knights | 4 | 1st season | 80.6 |
2002 | Roosters | 3 | 1st season | 76.7 |
2003 | Panthers | 0 | 10th season | 70 |
2004 | Bulldogs | 5 | 7th season | 83.2 |
2005 | Tigers | 0 | 21st season | 81.6 |
2006 | Broncos | 9 | 20th season | 71.2 |
2007 | Storm* | 7 | 5th season | 69.2 |
2008 | Sea Eagles | 1 | 5th season | 67.3 |
2009 | Storm* | 6 | 7th season | 71.5 |
2010 | Dragons | 7 | 24th season | 74 |
2011 | Sea Eagles | 4 | 8th season | 70.5 |
2012 | Storm | 4 | 10th season | 70.9 |
2013 | Roosters | 4 | 1st season | 84.1 |
2014 | Rabbitohs | 3 | 3rd season | 79.1 |
2015 | Cowboys | 4 | 2nd season | 75.6 |
2016 | Sharks | 4 | 6th season | 73.6 |
2017 | Storm | 6 | 15th season | 75.4 |
2018 | Roosters | 3 | 6th season | 74.8 |
2019 | Roosters | 3 | 7th season | 75.2 |
2020 | Storm | 6 | 18th season | 86.2 |
2021 | Panthers | 7 | 15th season | 82 |
2022 | Panthers | 7 | 16th season | 83.6 |
Survivor style, what does it all mean?
So if you apply these trends to the 2023 premiership, who is still in the running for the trophy?
No one has come from lower than 13th the year before so that means the Knights, Warriors and last year’s wooden spooners Wests Tigers get the red line put through them.
Panthers Sharks Cowboys Eels Storm Roosters Rabbitohs Raiders Broncos Dragons Manly Bulldogs Titans KnightsWarriorsTigers Dolphins
You can’t be 12th or lower at the halfway point of the season, if history is any guide, so that’s bad news for the Eels, Titans, Cowboys, Bulldogs and Dragons.
Panthers Sharks CowboysEels Storm Roosters Rabbitohs Raiders Broncos Dragons Manly BulldogsTitansKnightsWarriorsTigers Dolphins

(Photo by Matt King/Getty Images)
That means the remaining nine teams need to finish the regular season in the top four.
Premiership-winning teams can’t be ranked below 12th in attack so that means the Sea Eagles, Storm and Roosters are not going to be premiers based on their current ratings of 13th, 14th and 17th respectively.
Panthers Sharks CowboysEelsStormRoosters Rabbitohs Raiders Broncos DragonsManlyBulldogsTitansKnightsWarriorsTigers Dolphins
And your defence can be no lower than 10th so of the remaining six sides, the Dolphins (12th) and Raiders (16th) don’t survive this cut.
Panthers Sharks CowboysEelsStormRoosters Rabbitohs Raiders Broncos DragonsManlyBulldogsTitansKnightsWarriorsTigers Dolphins
That leaves four possible premiers – have they scored 38 or more in a game? Penrith – 53, tick. Cronulla – 44, tick. Souths – 50, tick. Brisbane have done so three times – tick, tick, tick.
Panthers Sharks CowboysEelsStormRoosters Rabbitohs Raiders Broncos DragonsManlyBulldogsTitansKnightsWarriorsTigers Dolphins
Have any of them conceded 50? Broncos let in 32 against the Bunnies, who had 36 put on them by Parra. Cronulla’s worst is 36 while 20 is the most anyone’s put on Penrith so far this season.
Panthers Sharks CowboysEelsStormRoosters Rabbitohs Raiders Broncos DragonsManlyBulldogsTitansKnightsWarriorsTigers Dolphins

Patrick Carrigan. (Photo by Robert Cianflone/Getty Images)
For and against wise, the Panthers and Rabbitohs are already into three figures and the Broncos and Sharks are knocking on the door, so nothing to see here, move along.
Panthers Sharks CowboysEelsStormRoosters Rabbitohs Raiders Broncos DragonsManlyBulldogsTitansKnightsWarriorsTigers Dolphins
For and against wise, the Panthers and Rabbitohs are already into three figures and the Broncos and Sharks are knocking on the door, so nothing to see here, move along.
Home and away record, they’re all smashing it on the road but Cronulla are only just staying alive at 3-4 at Shark Park.
Panthers Sharks CowboysEelsStormRoosters Rabbitohs Raiders Broncos DragonsManlyBulldogsTitansKnightsWarriorsTigers Dolphins
As for the remaining factors like Origin reps, their coach’s experience and goal-kicking , the Panthers are leaders in all three categories with six NSW players in game one, Ivan Cleary having a lot more years under his belt than Jason Demetriou, Craig Fitzgibbon and Kevin Walters and Penrith nailing kicks at 87.7% through Nathan Cleary and Stephen Crichton.
So there you have it.
Based on these key performance indicators, there are realistically only four teams that could become premiers this year unless there are drastic form changes in the remaining rounds of the season.
And those Panthers from Sydney’s west look like they’re well on track to becoming the first team since the 1983 Parramatta Eels to pull off the rare premiership three-peat.
But if you’ve made it this far you will know that the only surefire prediction you can make in rugby league is that until their team is are no longer a mathematical chance, every fan has hope.
And it’s the hope that kills you.
First appear at What are the KPIs for a premiership-winning team? It adds up to only four clubs a hope of winning 2023 NRL title